Angelica Gray Private
Protected case study

Need access? Contact me on LinkedIn

Incorrect password — please try again.
← Back to all work
PepsiCo

Designing PepsiCo's cost transformation web application

Cost-to-serve · store level
Cohort vs. business
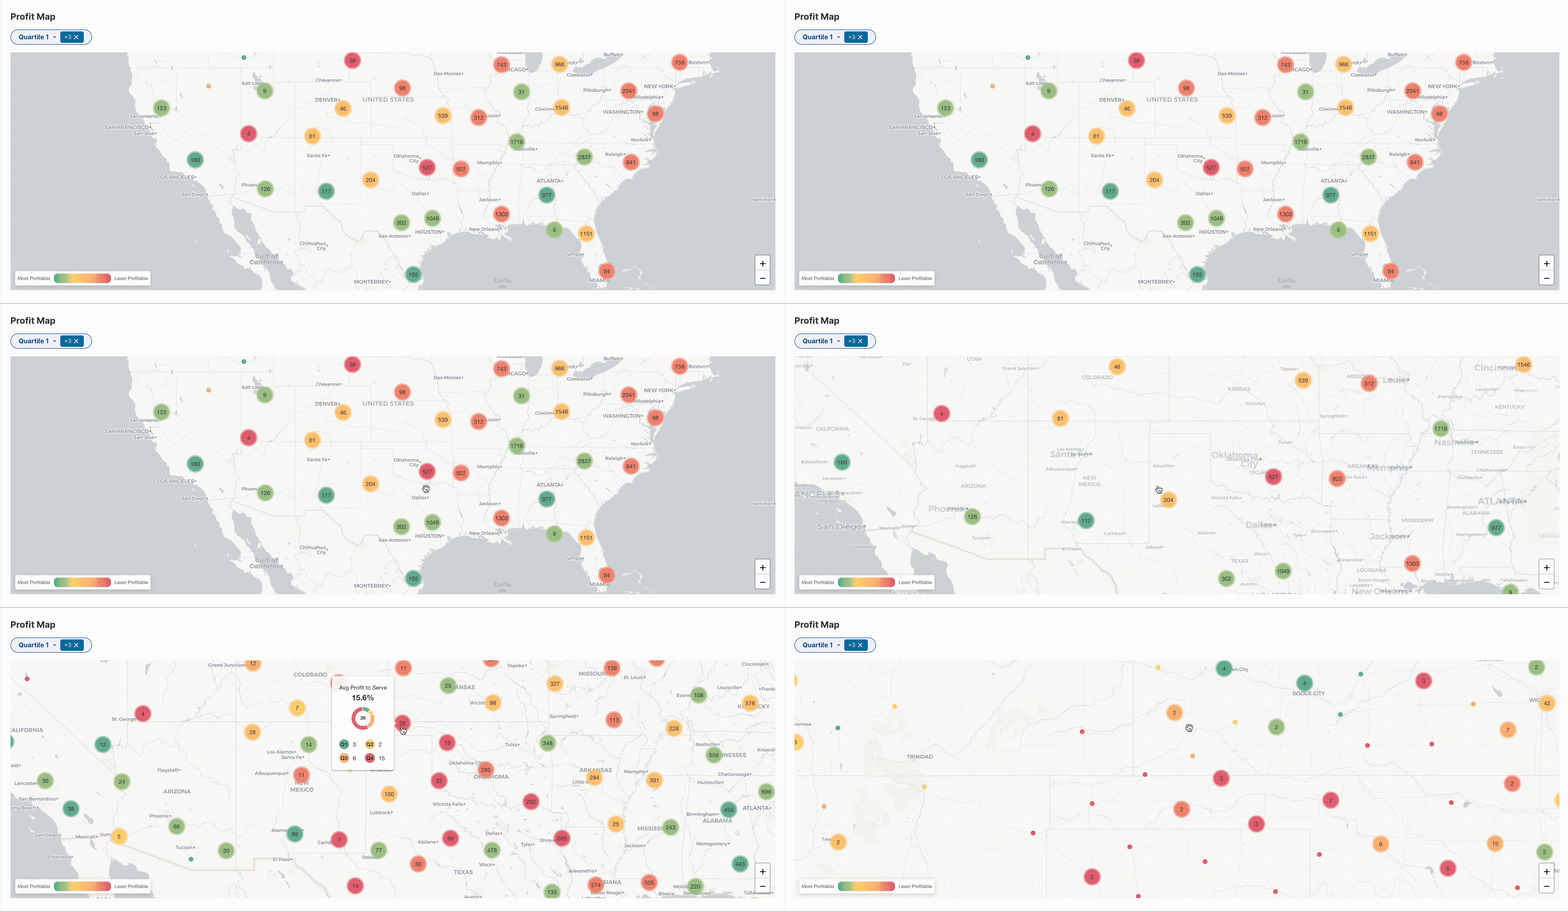
Profit map — cost-to-serve by store
My role
UX Designer · team of 3
Research · IA · prototyping · stakeholders
Timeline
6 months
Concept → MVP launch
Context
Enterprise internal tool
Store-level cost analytics · CPG
Status
MVP launched
High adoption · currently scaling
01 Overview

CTX was created to give PepsiCo a competitive edge in the CPG marketplace by delivering granular, store-level cost insights.

As product portfolios and strategies grew more complex, relying on regional averages was no longer enough. The business needed detailed, connected data to make smarter, faster decisions — and a tool that could surface it without a data analyst in the room.

I moved the concept through stakeholder critique and workshops, validated high-fidelity prototypes with leadership, then supported QA and launch.

02 THE PROBLEM

Regional averages couldn't see the real costs.

Store-level data collection was manual, siloed, and time-consuming — which limited the team's ability to act quickly on cost and performance opportunities. By the time numbers were reconciled, the moment to respond had often passed.

The team needed a coordinated, data-informed approach to drive cost transformation across the full value chain.

Before → After · how decisions got made
Before — regional averages
Costs rolled up to one regional number
Manual, siloed data pullsslow
Outliers hidden inside the average
Opportunities missedreactive
After — store-level CTX
Every store visible individually
Connected, self-serve datafast
Profit drivers surfaced automatically
Act on the outliersproactive
03 My role & responsibilities
01
User research
Built on inherited research and a defined persona to ground every decision in real user needs.
02
Information architecture
Structured dense, connected cost data into views a business user could actually navigate.
03
Prototyping
Iterated wireframes into high-fidelity prototypes to test ideas and align the team fast.
04
Stakeholder management
Facilitated critiques, workshops, and check-ins to balance business, technical, and user needs.
04 Discovery & concept direction

I picked up early research, one persona — the CTX Power User — and a set of wireframes. From there I iterated the wireframes, ideated potential solutions, and worked with stakeholders to prioritize features, keeping the product feasible, user-centered, and aligned with business goals.

P
Inherited persona
CTX Power User
A business user who lives in cost & performance data and needs to move from regional summaries to store-level detail — fast, and without an analyst's toolkit.
Key user & stakeholder needs
  • See cost & performance at the store level, not just the region.
  • Spot the stores driving — or draining — profit at a glance.
  • Compare a chosen cohort against the overall business.
  • Trust the numbers enough to act without re-checking them.
Process artifact · early wireframes
FIG 01  ·  wireframe iterations — inherited concept → prioritized direction
05 The solution

End-to-end visibility, at the store level.

Our team built CTX to give end-to-end visibility into costs and performance at the store level. The tool leverages growing datasets and technology to uncover next-gen cost opportunities — focusing on total cost-to-serve and enabling strategic, data-backed decisions. Three capabilities anchored the MVP.
01
The whole business, two ways
An overarching look at the business with both high-level and granular performance metrics in one place.
02
Key profit drivers
Surfacing the levers that move margin — and flagging the potential problem areas worth attention first.
03
Easy comparisons
Compare a selected cohort against the overall business, so context is always one glance away.
From problem to outcome
Problem
Regional averages hid the stores that actually drove cost.
Insight
Users needed to see outliers — not a smoothed-out number.
Design decision
Lead with store-level detail and cohort-vs-business comparison.
Outcome
Faster, more confident cost decisions across the team.
06 Inside the product
ctx.pepsico.internal / overview
FIG 02  ·  CTX overview — high-level and granular performance metrics in one view
Annotated · a UI decision
ctx.pepsico.internal / e2e-profitability
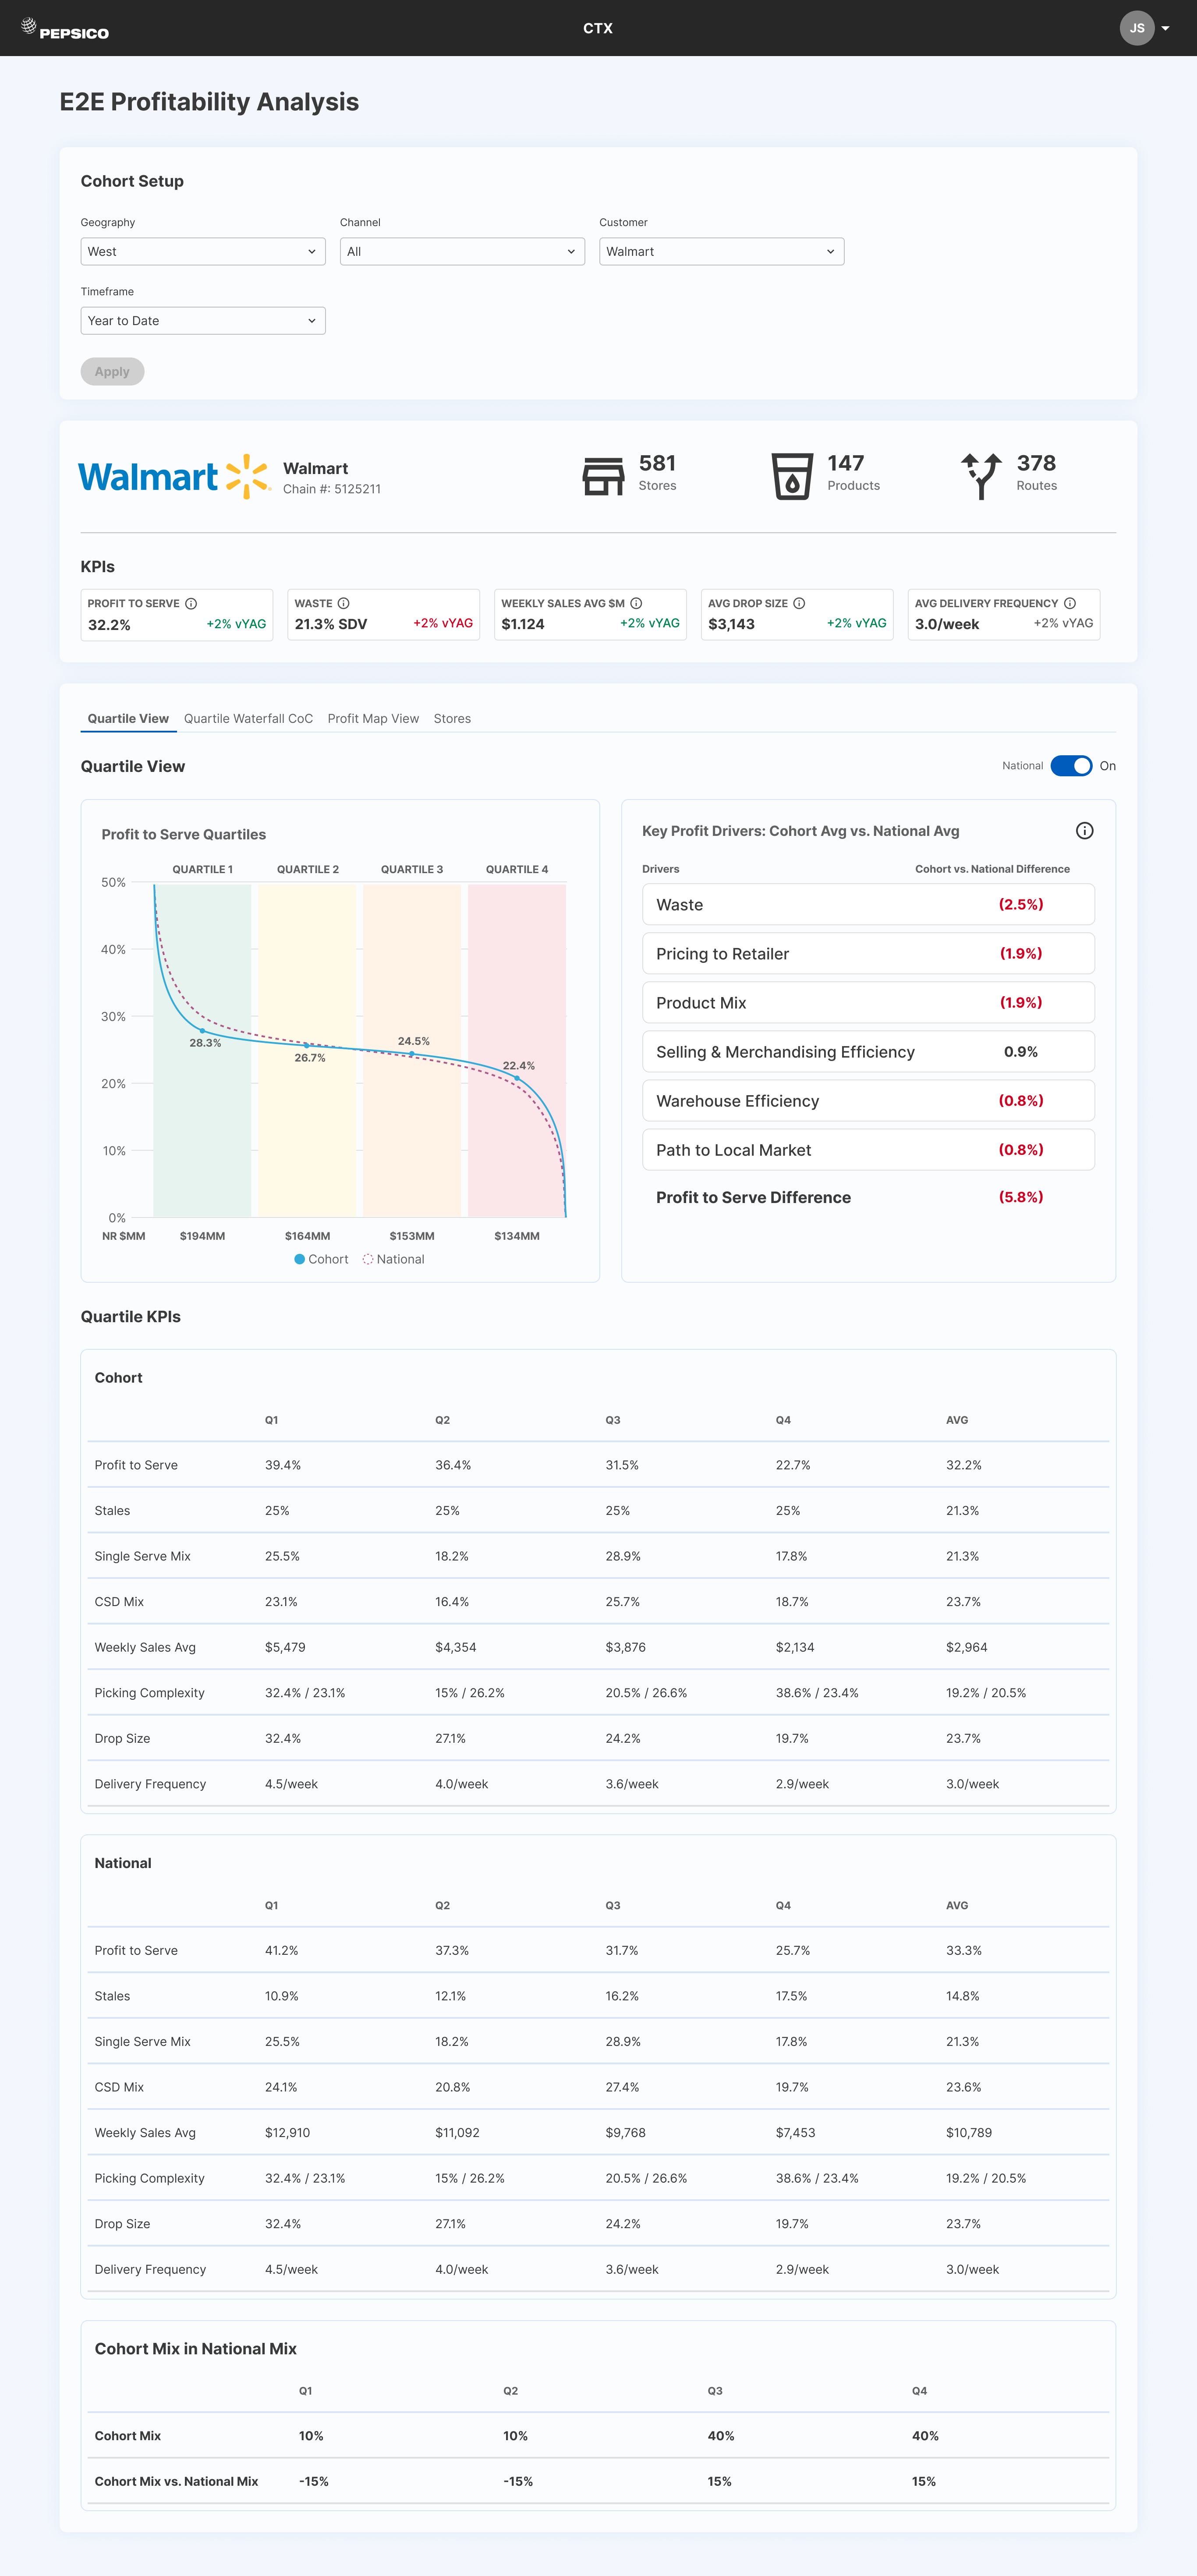
CTX E2E Profitability Analysis — Walmart cohort, store-level KPIs, quartile view and cohort-vs-national comparison A C B
AA birds-eye view
High-level KPIs — profit-to-serve, waste, drop size — sit up top so a business user reads the health of the cohort at a glance.
BKey profit drivers
The drivers panel ranks where margin leaks — waste, pricing, product mix — so problem areas surface without reading the whole table.
CComparison is always on
The quartile curve plots cohort against national in one view, so context never requires a second screen.
FIG 03  ·  E2E Profitability Analysis — Walmart cohort, annotated
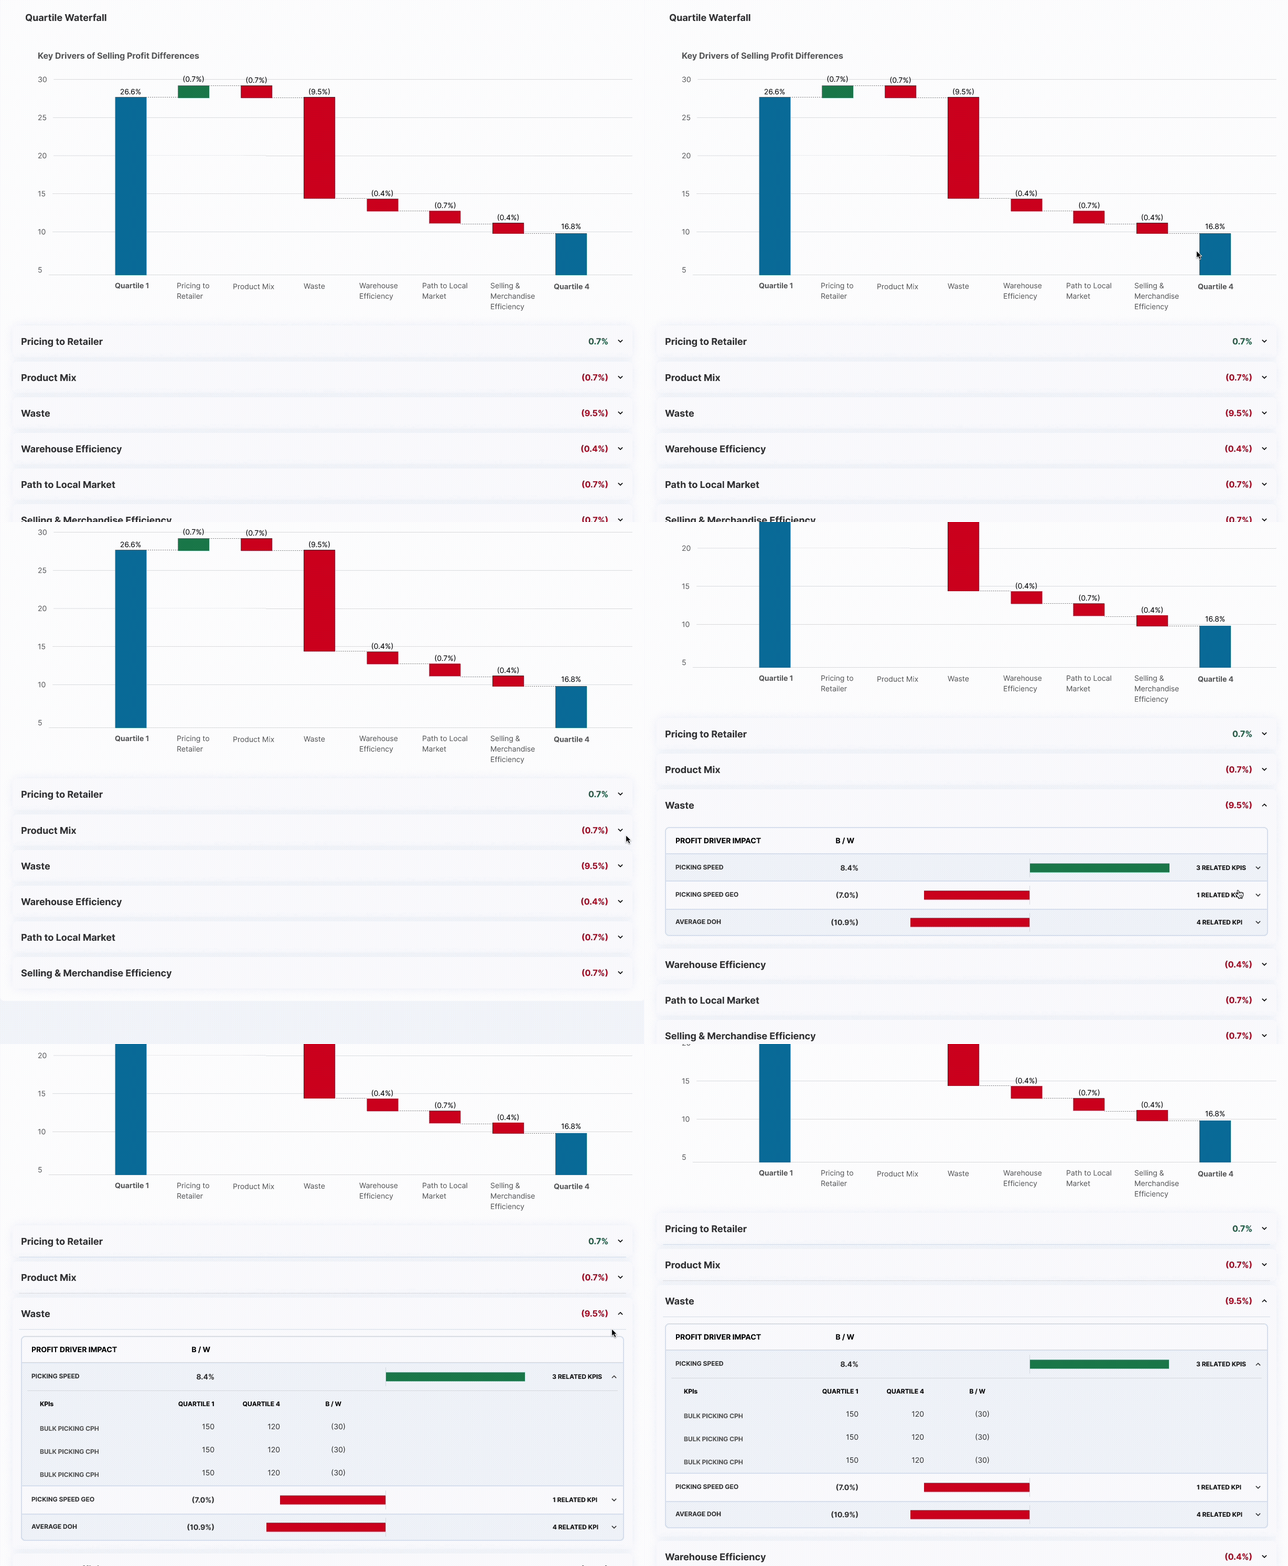
ctx.pepsico.internal / quartile-waterfall
CTX quartile waterfall — key drivers of selling-profit differences, recorded walkthrough
FIG 04  ·  quartile waterfall — surfacing the key drivers of selling-profit differences
ctx.pepsico.internal / quartile-view
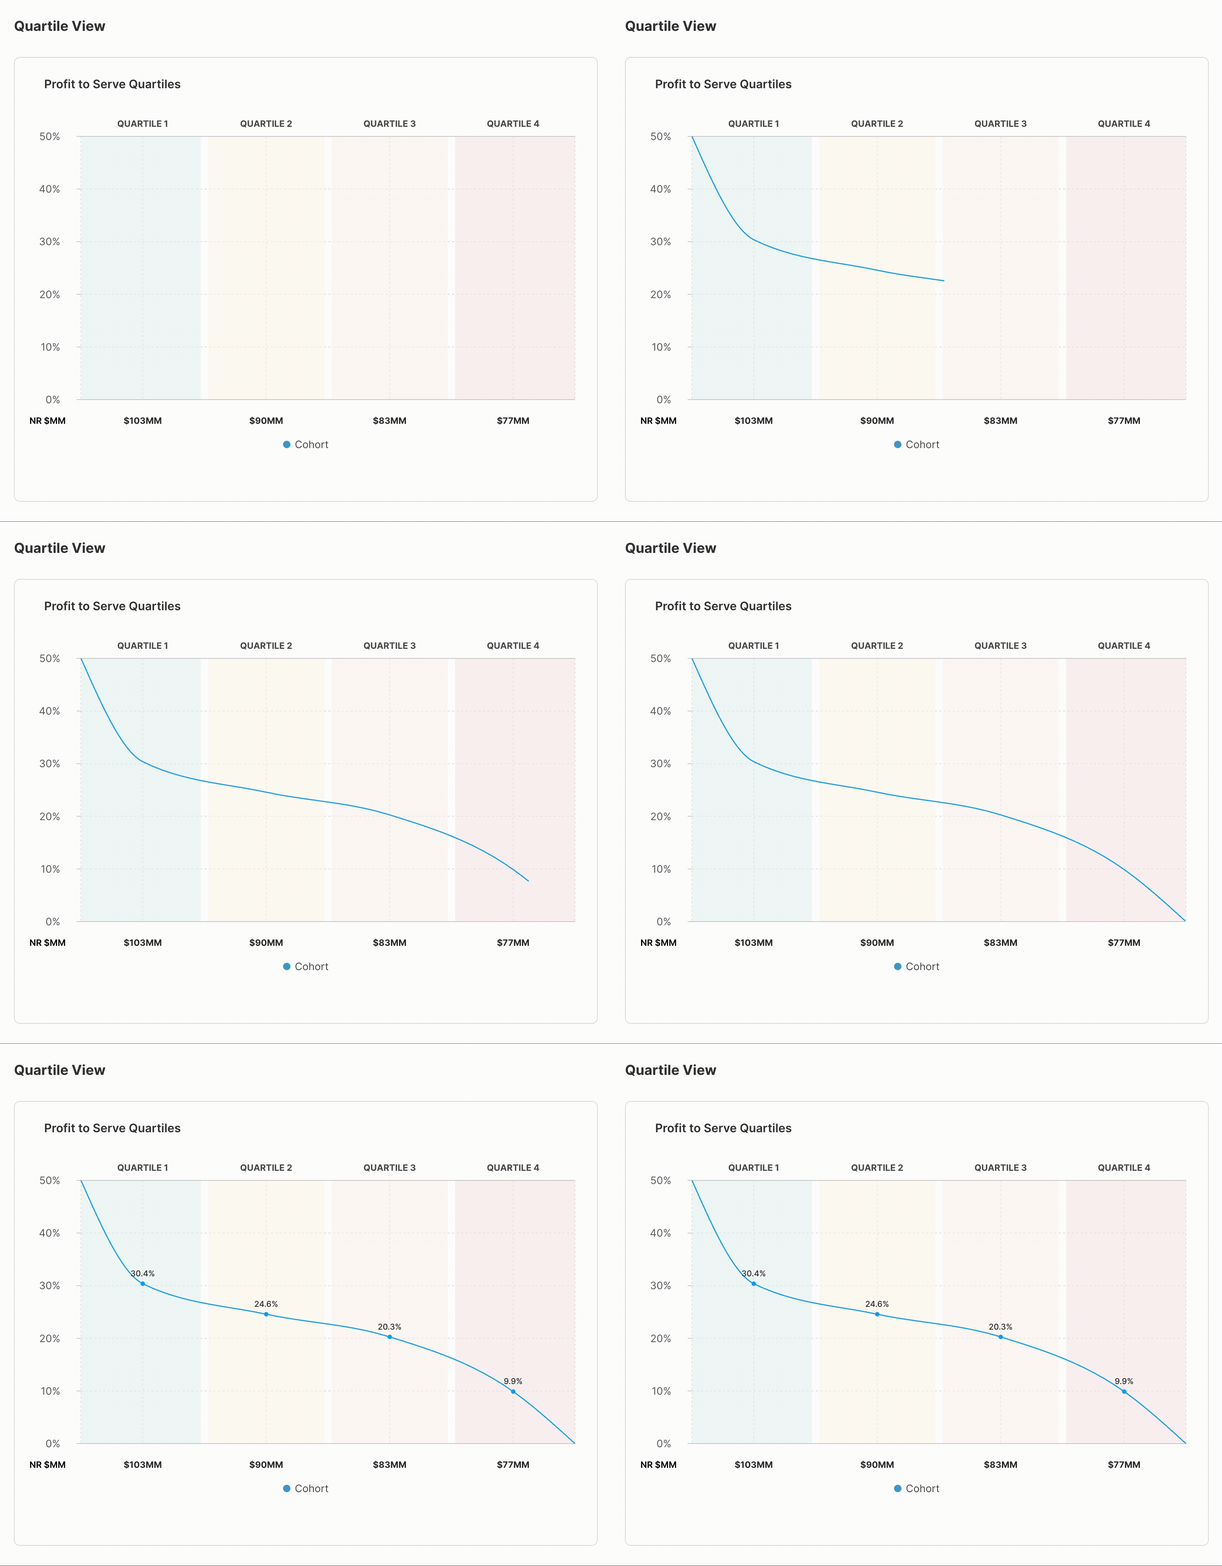
CTX profit-to-serve quartiles — cohort comparison view, recorded walkthrough
FIG 05  ·  profit-to-serve quartiles — cohort across the business
ctx.pepsico.internal / geography
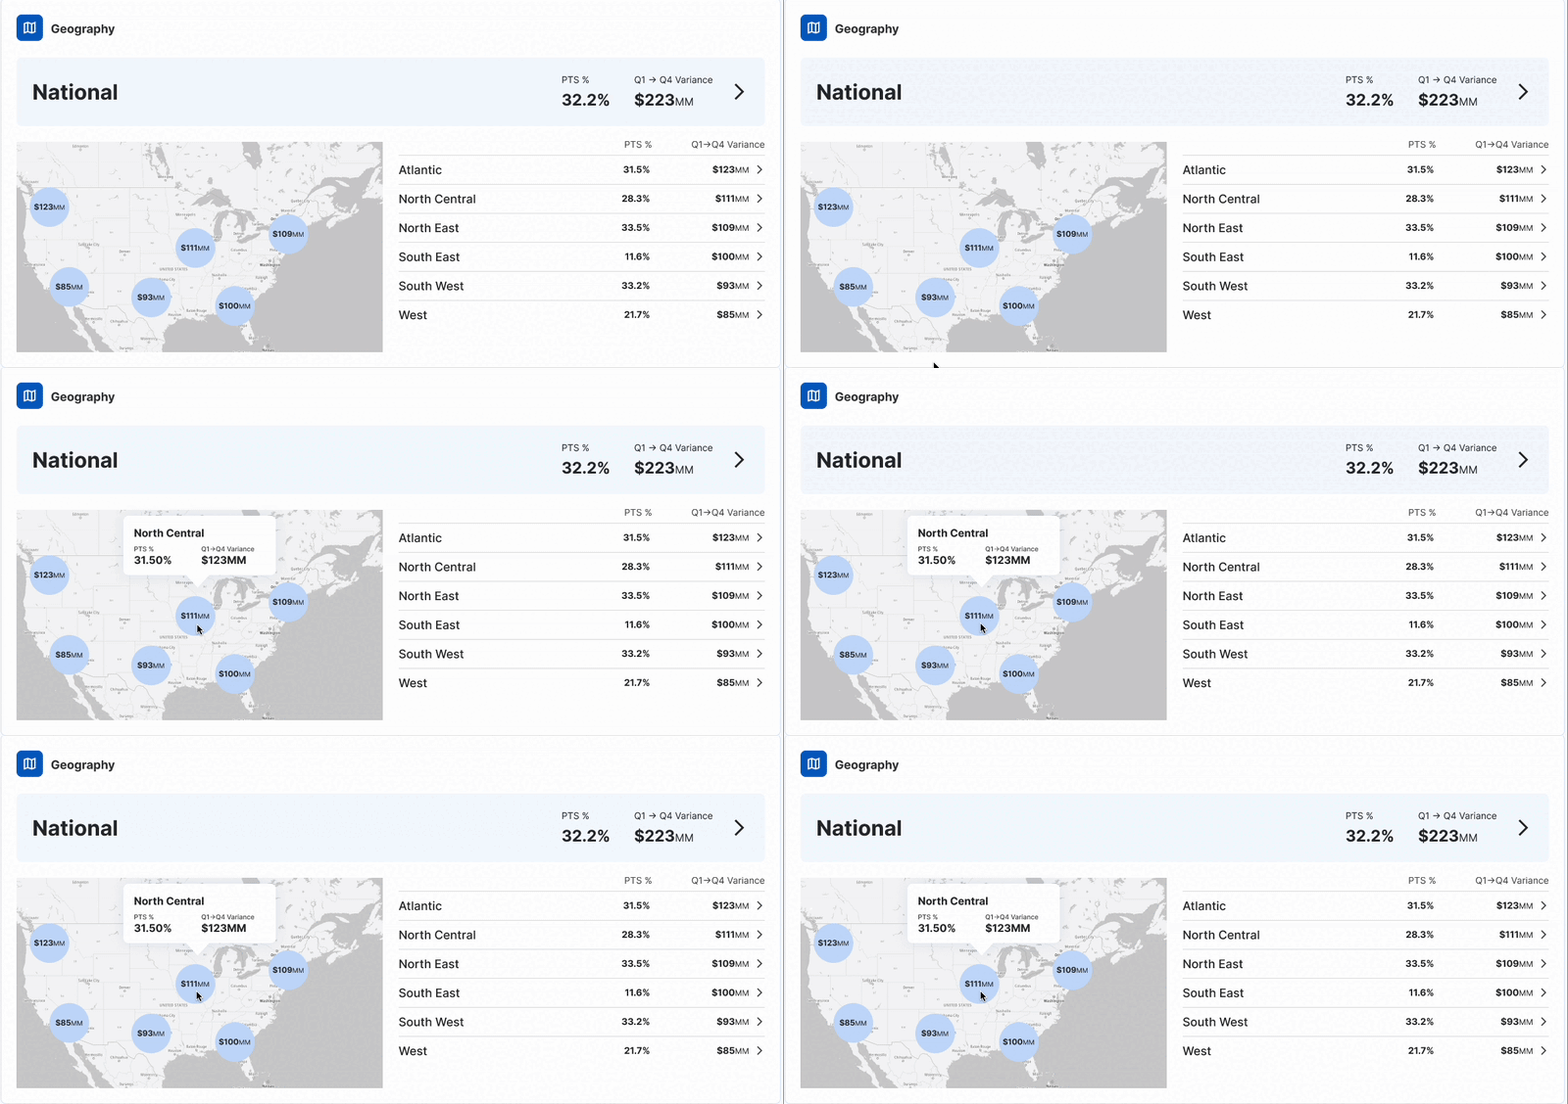
CTX geography view — national profit-to-serve and store-level cost concentrations by region, recorded walkthrough
FIG 06  ·  geography view — profit-to-serve by region
07 Outcomes

What the MVP moved.

0%
adoption by target users
0%
faster reporting
0/10
overall satisfaction rating

Measured against the prior manual, regional-average baseline. The MVP launched on schedule, saw high adoption, and is currently scaling.

Next case study · 02
Redesigning a patient experience management homepage — Xamplifier
Read next